DMA Data and Results
dmadb.bham.ac.uk/data_and_results_summary/
Compound annotations
All compound annotations derived from the DMA are summarised at dmadb.bham.ac.uk/compounds/.
The annotations have been summarised across all of the DMA assays that have been analysed with Galaxy DMA workflow but also merged with some external annotation sources including annotation via GNPS, mzCloud and annotations from NMR and GC-MS.
As the Deep Metabolome Annotation has only been done on one organism (Daphnia magna) - this section is currently only summarising the annotation for D. magna.
The compounds are distinguished by a unique InChiKey and can filtered and searched by the following columns
Column name |
Description |
|---|---|
Monoisotopic exact mass |
The monoisotopic exact mass of the annotation (derived from PubChem) |
Inchikey |
InChIKey - International Chemical Identifier Key |
Inchi |
InChi - International Chemical Identifier |
Smiles |
SMILES - Simplified molecular-input line-entry system |
Compound name |
Compound name of annotation |
Natural product inchikey1 |
Check if the first component of the InChIKey of the metabolite annotation matches that of the Natural products listed from the “COCONUT - the COlleCtion of Open Natural ProdUcT” |
Pubchem cids |
List of all PubChem CIDs found for this InChiKey |
Hmdb ids |
List of all HMDB IDs found for this InChiKey |
Kegg ids |
List of all KEGG IDs found for this InChiKey |
Chebi ids |
List of all ChEBI IDs found for this InChiKey |
Kingdom |
Kingdom compound classification from ClassyFire |
Superclass |
Superclass compound classification from ClassyFire |
Subclass |
Subclass compound classification from ClassyFire |
Direct parent |
Direct parent compound classification from ClassyFire |
Molecular framework |
Molecular framework of compound from ClassyFire |
Predicted lipidmaps terms |
Predicted lipidmaps terms of compound from ClassyFire |
Extraction |
DMA liquid phase extraction protocol(s) the annotation observed in |
Spe |
DMA Solid Phase Extraction (SPE) protocol(s) the annotation observed in |
Spe frac |
DMA SPE fraction the annotation observed in |
Chromatography |
DMA chromatography protocol(s) the annotation observed in |
Measurement |
DMA measurement (LCMSMS, DIMSn, GCMS, NMR) protocol(s) the annotation observed in |
Polarity |
The mass spectrometry ionisation polarity the annotation observed in |
Nmrbool |
Boolean - true if annotation observed using NMR measurement |
Gcmsbool |
Boolean - true if annotation observed using GC-MS measurement |
Smbool |
Boolean - true if annotation observed using LC-MS/MS or DIMSn spectral matching to library spectra |
Metfragbool |
Boolean - true if annotation observed using MetFrag annotation software for LC-MS/MS or DIMSn data |
Siriusbool |
Boolean - true if annotation observed using SIRIUS CSI:FingerID annotation software for LC-MS/MS or DIMSn data |
Siriusbool |
Boolean - true if annotation observed using SIRIUS CSI:FingerID annotation software for LC-MS/MS or DIMSn data |
Mzcloudsmbool |
Boolean - true if annotation observed using mzCloud database for LC-MS/MS or DIMSn spectral matching annotation |
Galaxysmbool |
Boolean - true if annotation observed using Galaxy workflow for LC-MS/MS or DIMSn spectral matching annotation |
Gnpssmbool |
Boolean - true if annotation observed using GNPS workflow for LC-MS/MS or DIMSn spectral matching annotation |
Msi level |
The Metabolomics Standards Initiative (MSI) level for the annotation |
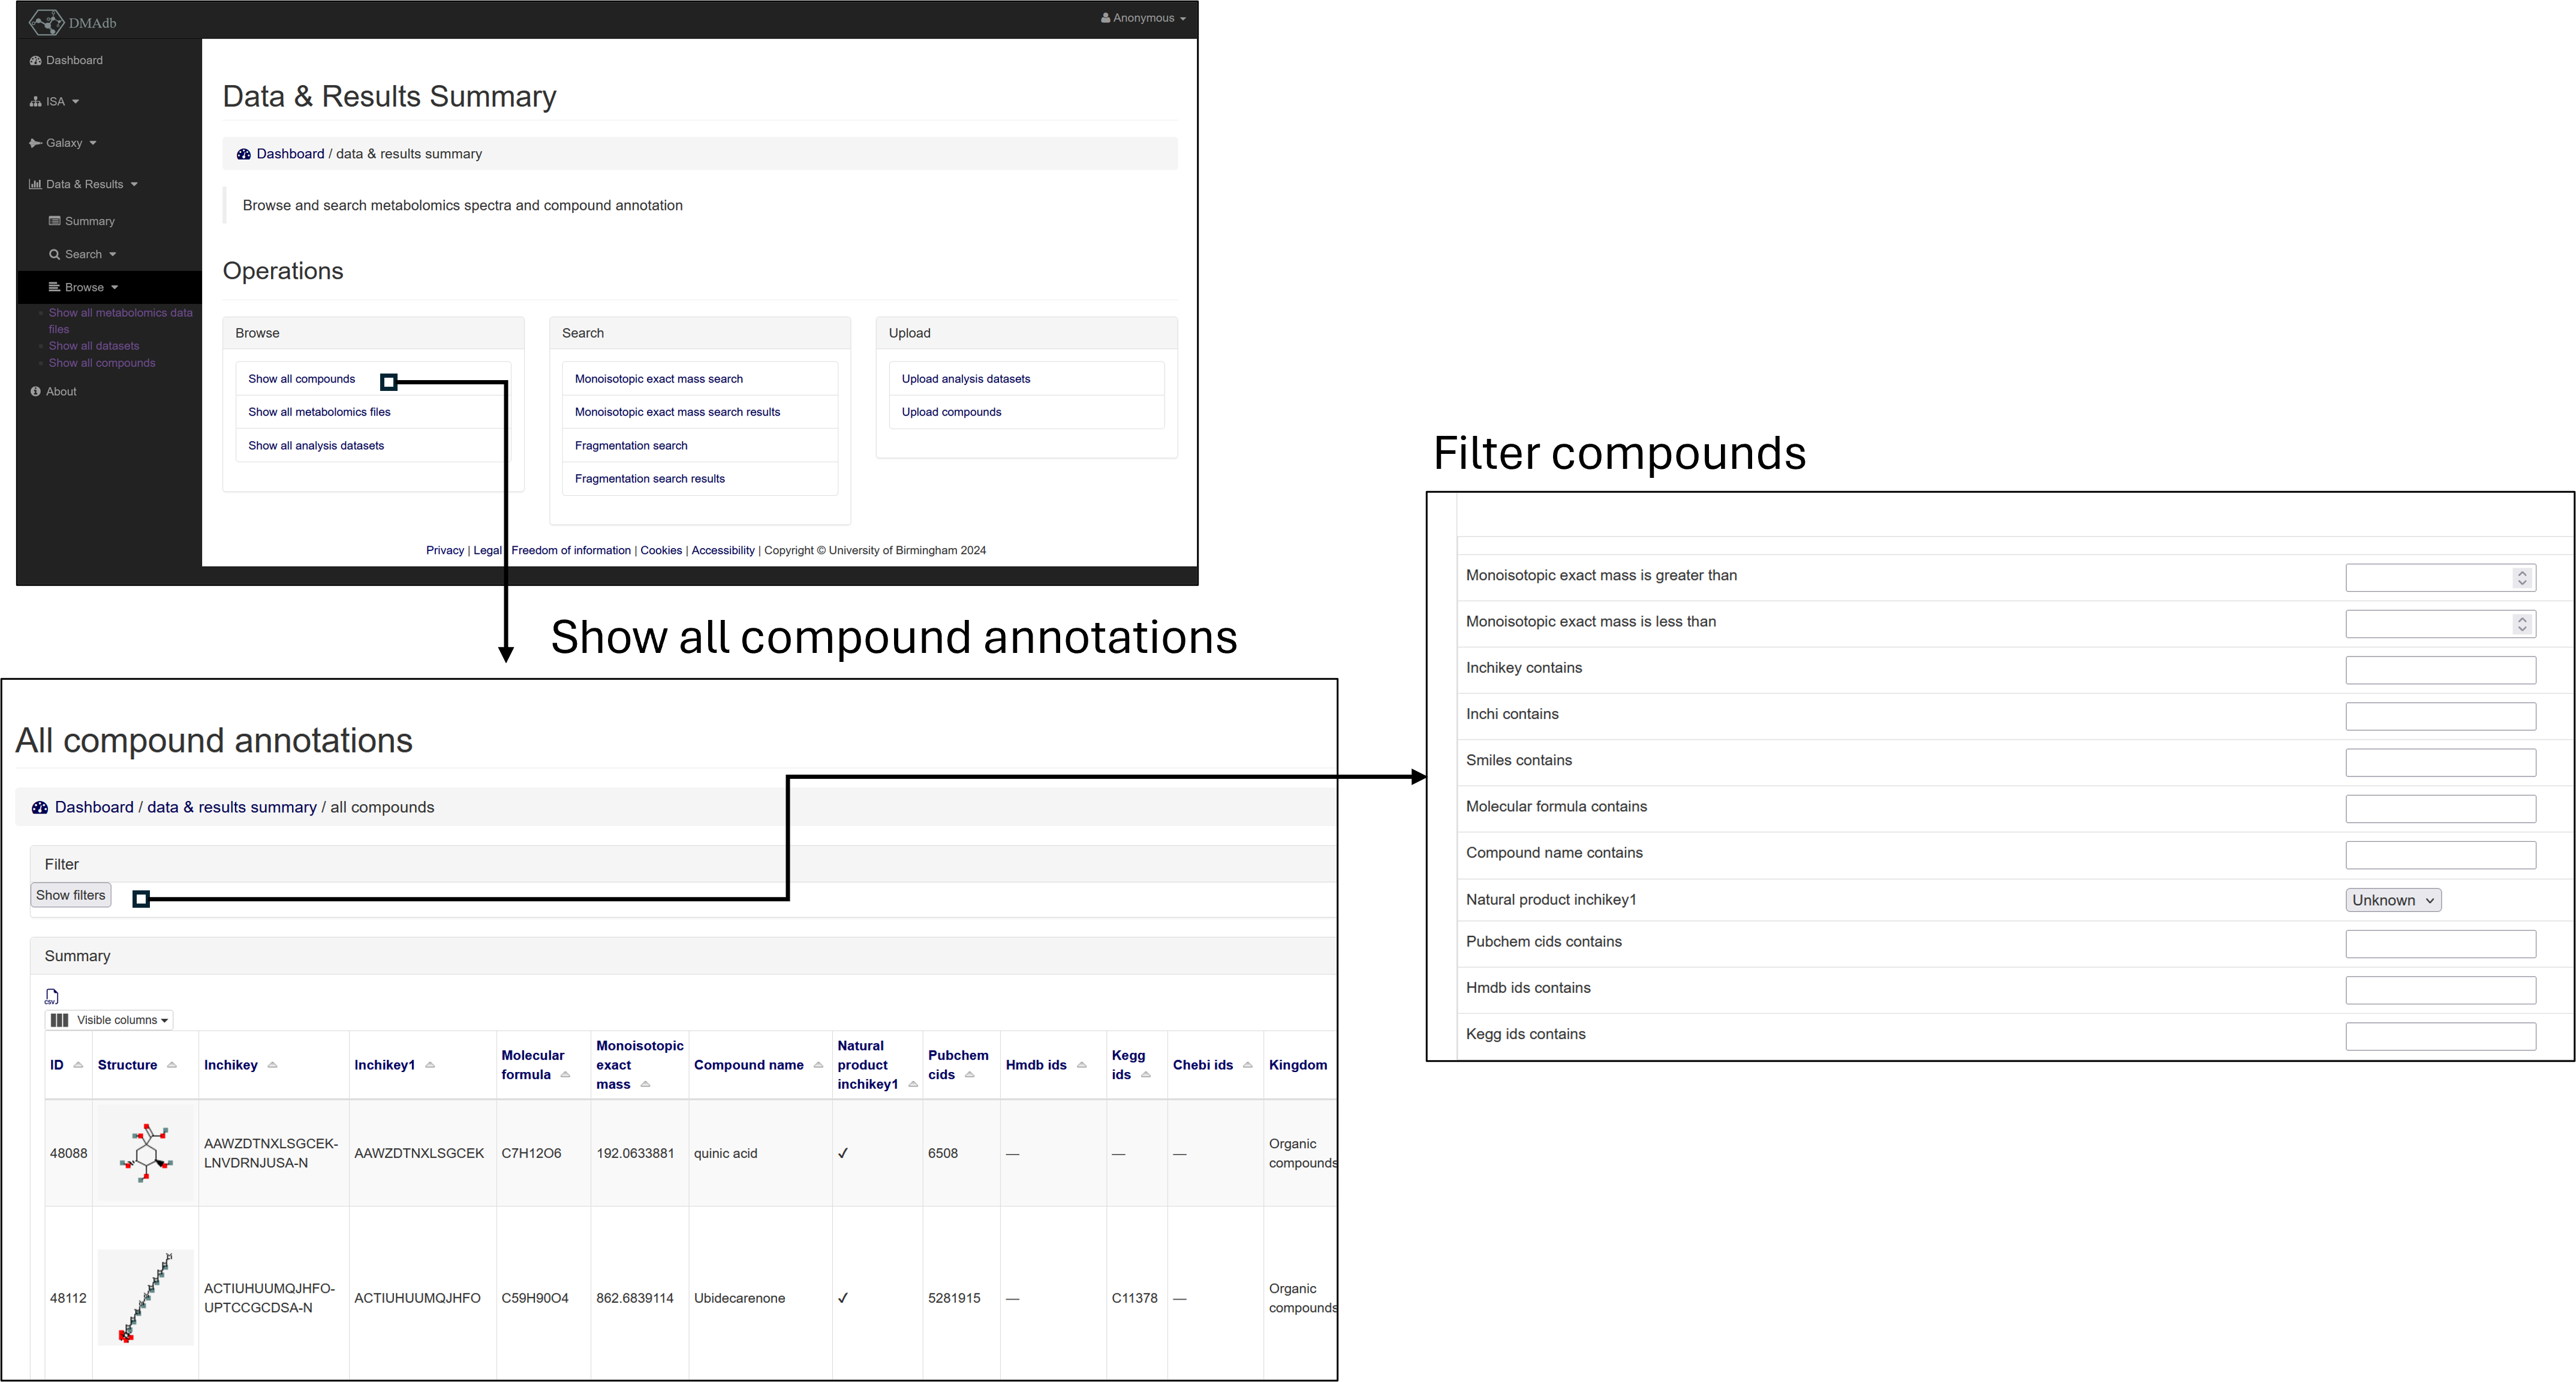
Fig 1. Browse and filter compound annotations
Individual compounds can be double clicked on to open up a page summarising where the annotations has been observed (currently only showing information related to DMA of D. magna)

Fig 2. Further details of compound annotations
Browse raw data files
The raw (and .mzML) data files can be browsed, filtered and downloaded from dmadb.bham.ac.uk/mfile_summary/.
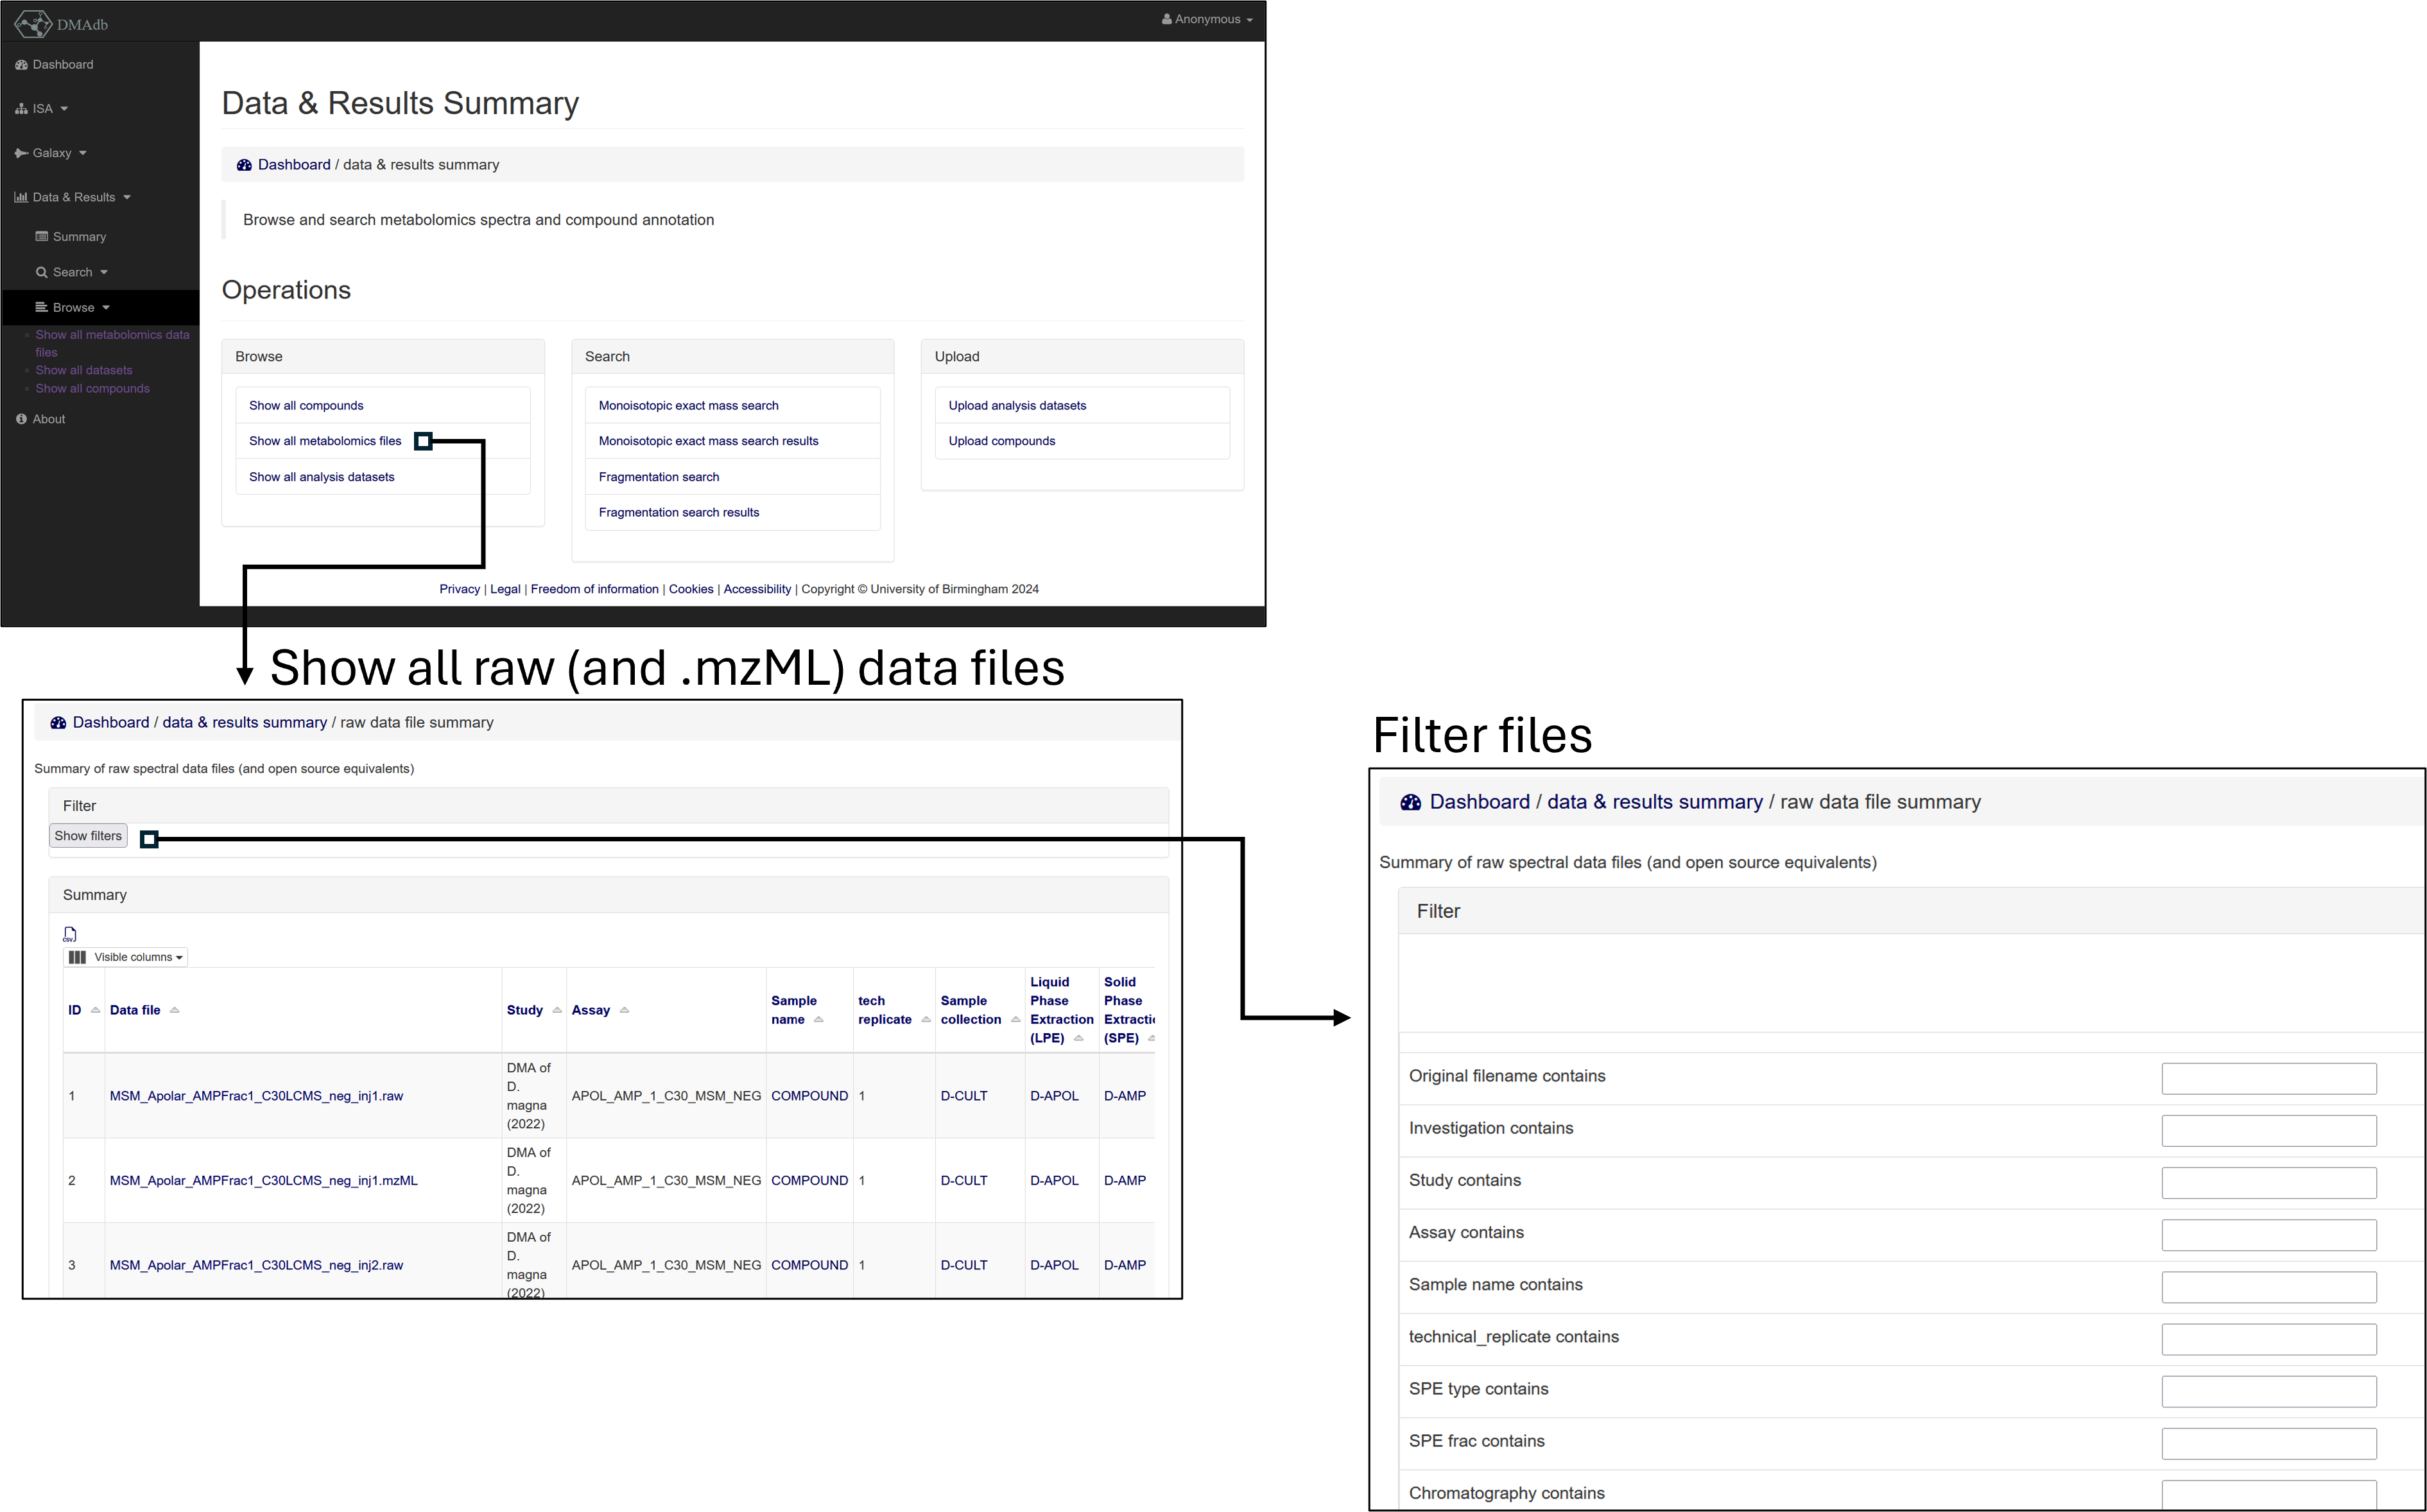
Fig 3. Browse, filter and download raw (and .mzML) mass spectrometry data files
Browse analysis datasets
The DMA Galaxy workflow outputs as a result an SQLite file for each DMA assay that has been analysed (incorporating the annotation and peak information from LC-MS, LC-MS/MS, DIMS and DIMSn data).
Each of these SQLite data files can be individually inspected through the DMAdb interface from dmadb.bham.ac.uk/dataset_summary/.
To access this information a user needs to have an account (i.e. a guest cannot access)
First the user can select the processed data file to choose from via using the filter option and can choose from the following options:
Column name |
Description |
|---|---|
Assay name |
The DMA assay from which the data was derived from |
Polarity |
The mass spectrometry ionisation polarity from which the data was derived from |
Metabolite standard |
Boolean - if true, then the data and results are for a metabolite reference standard mix (e.g. the assay was used for validation purposes rather that measuring the metabolite directly in an organism) |
Fractionation |
Boolean - if true, then the data and results are from the DMA fractionation assays and include information and annotations for both LC-MS, LC-MS/MS and the DIMS and DIMSn of LC fractions |
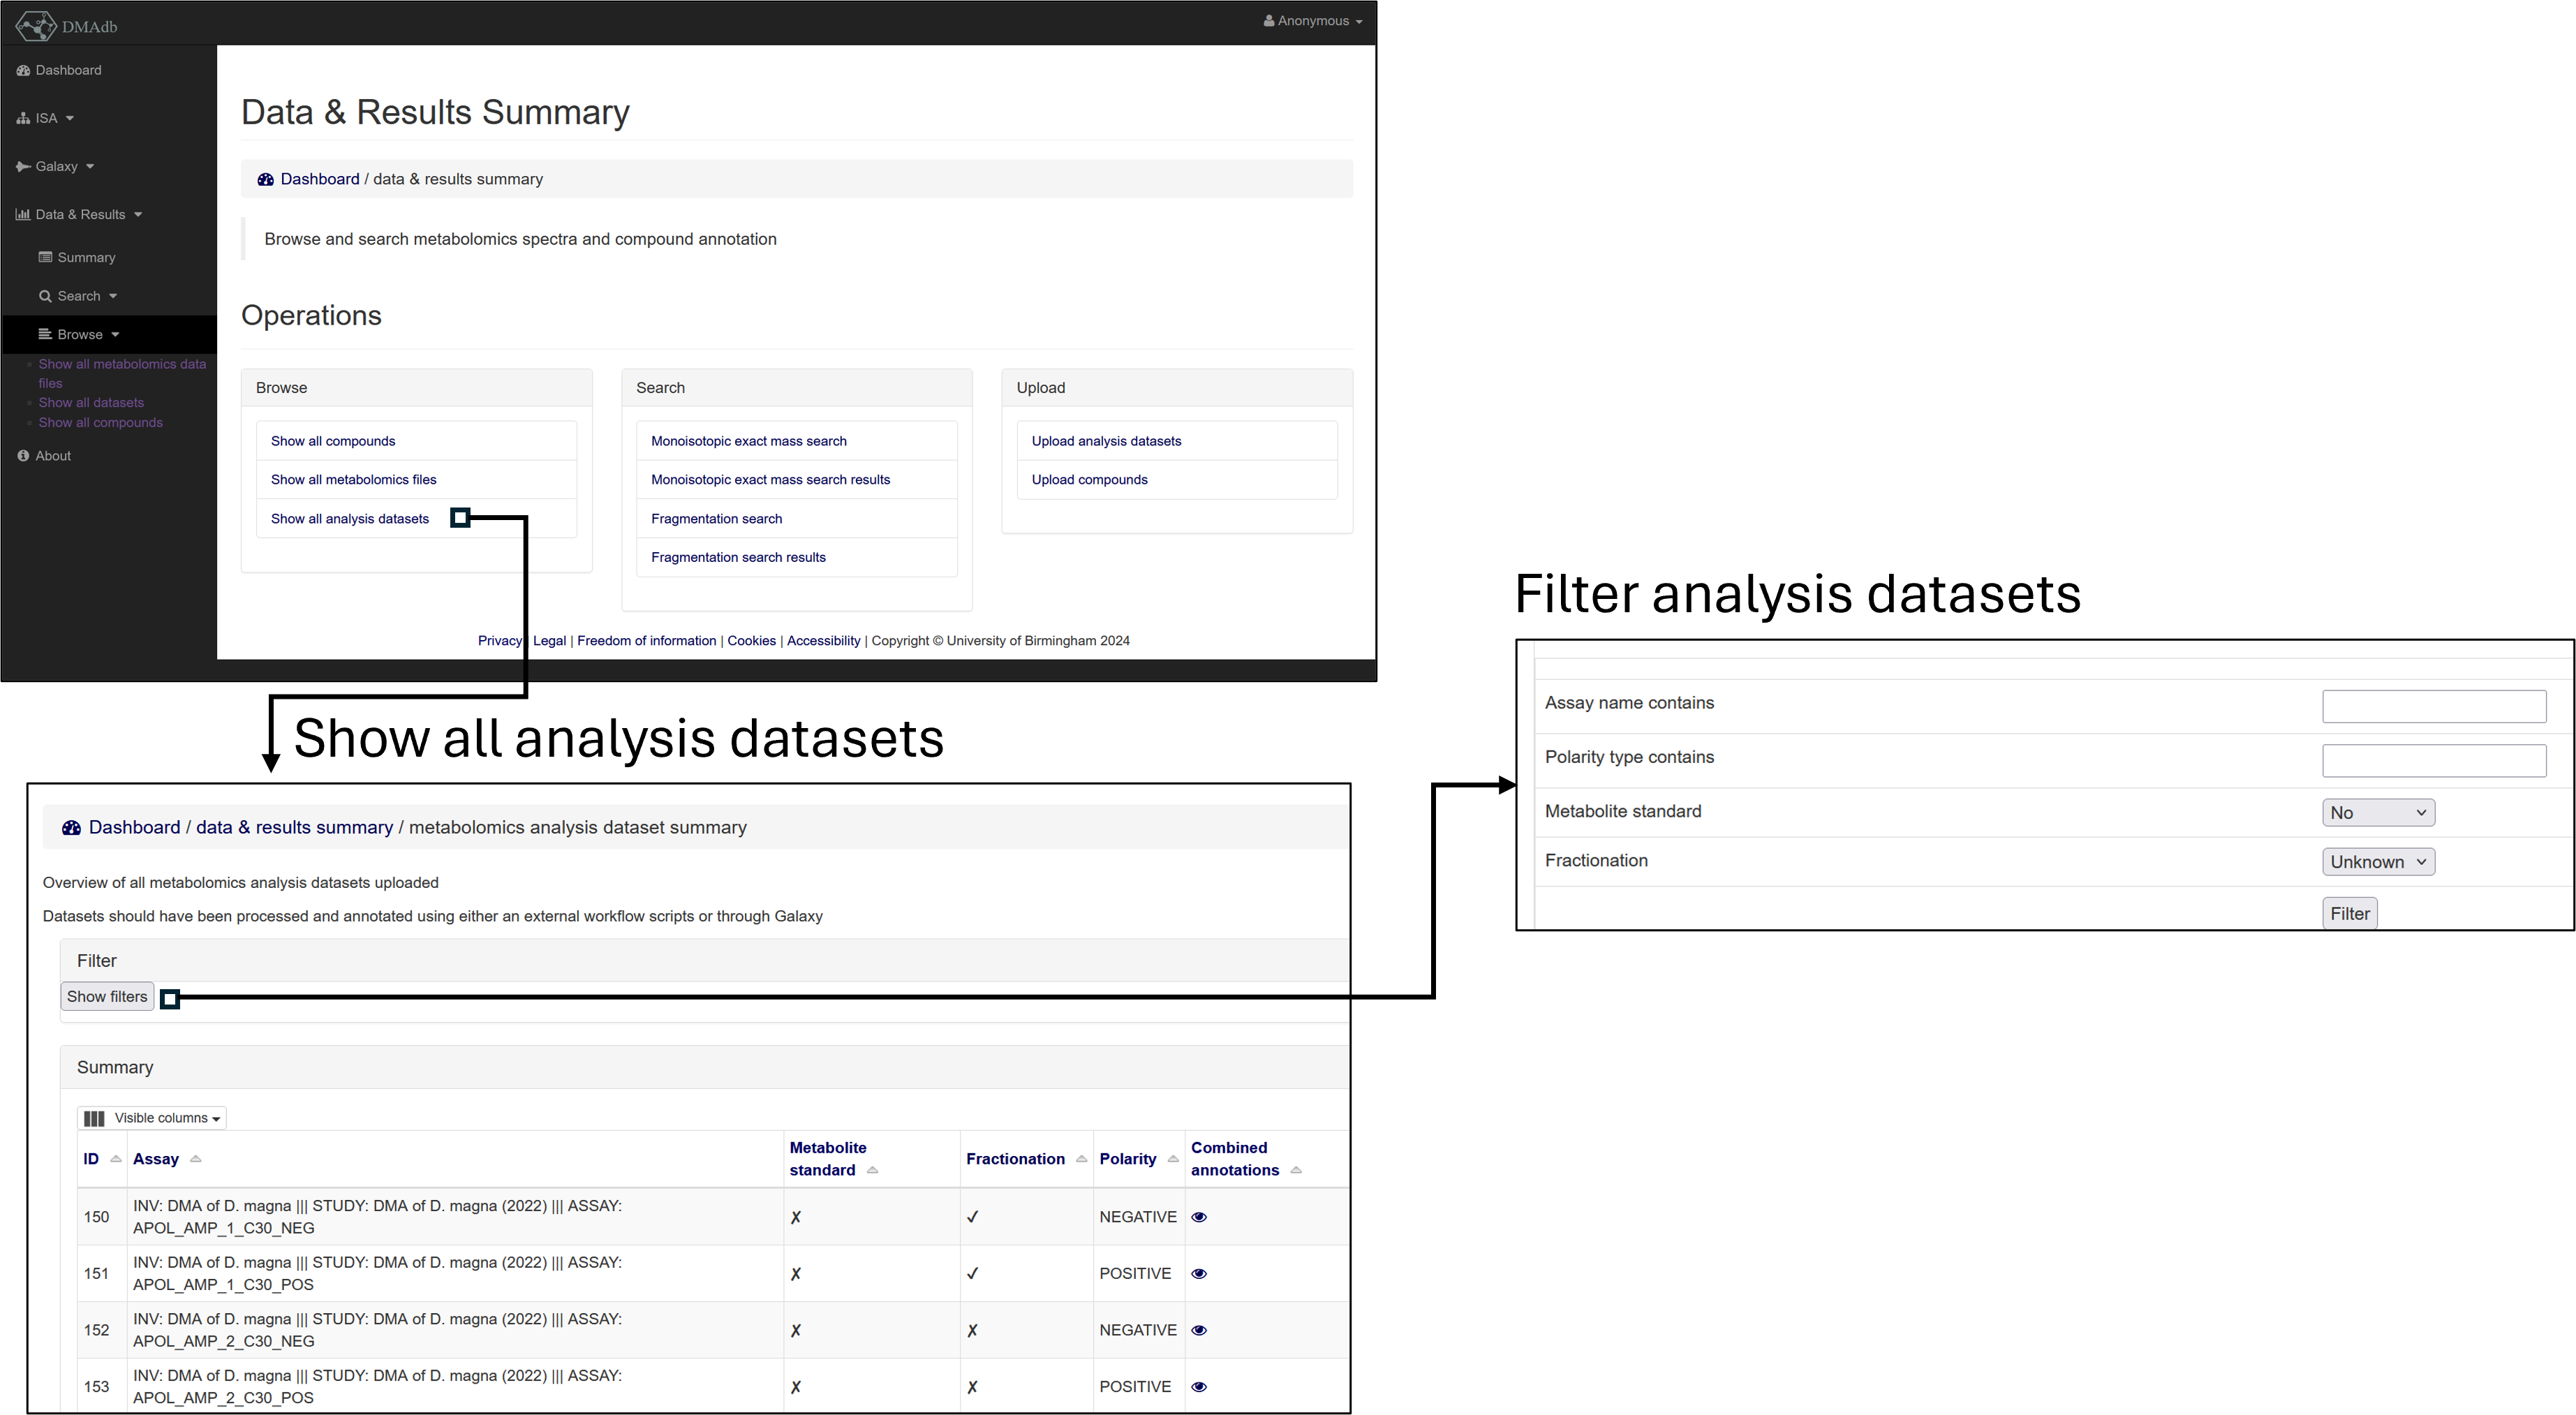
Fig 4. Select an filter analysis datasets
For each dataset a annotations and peaks can then be inspected which in turn can be filtered.
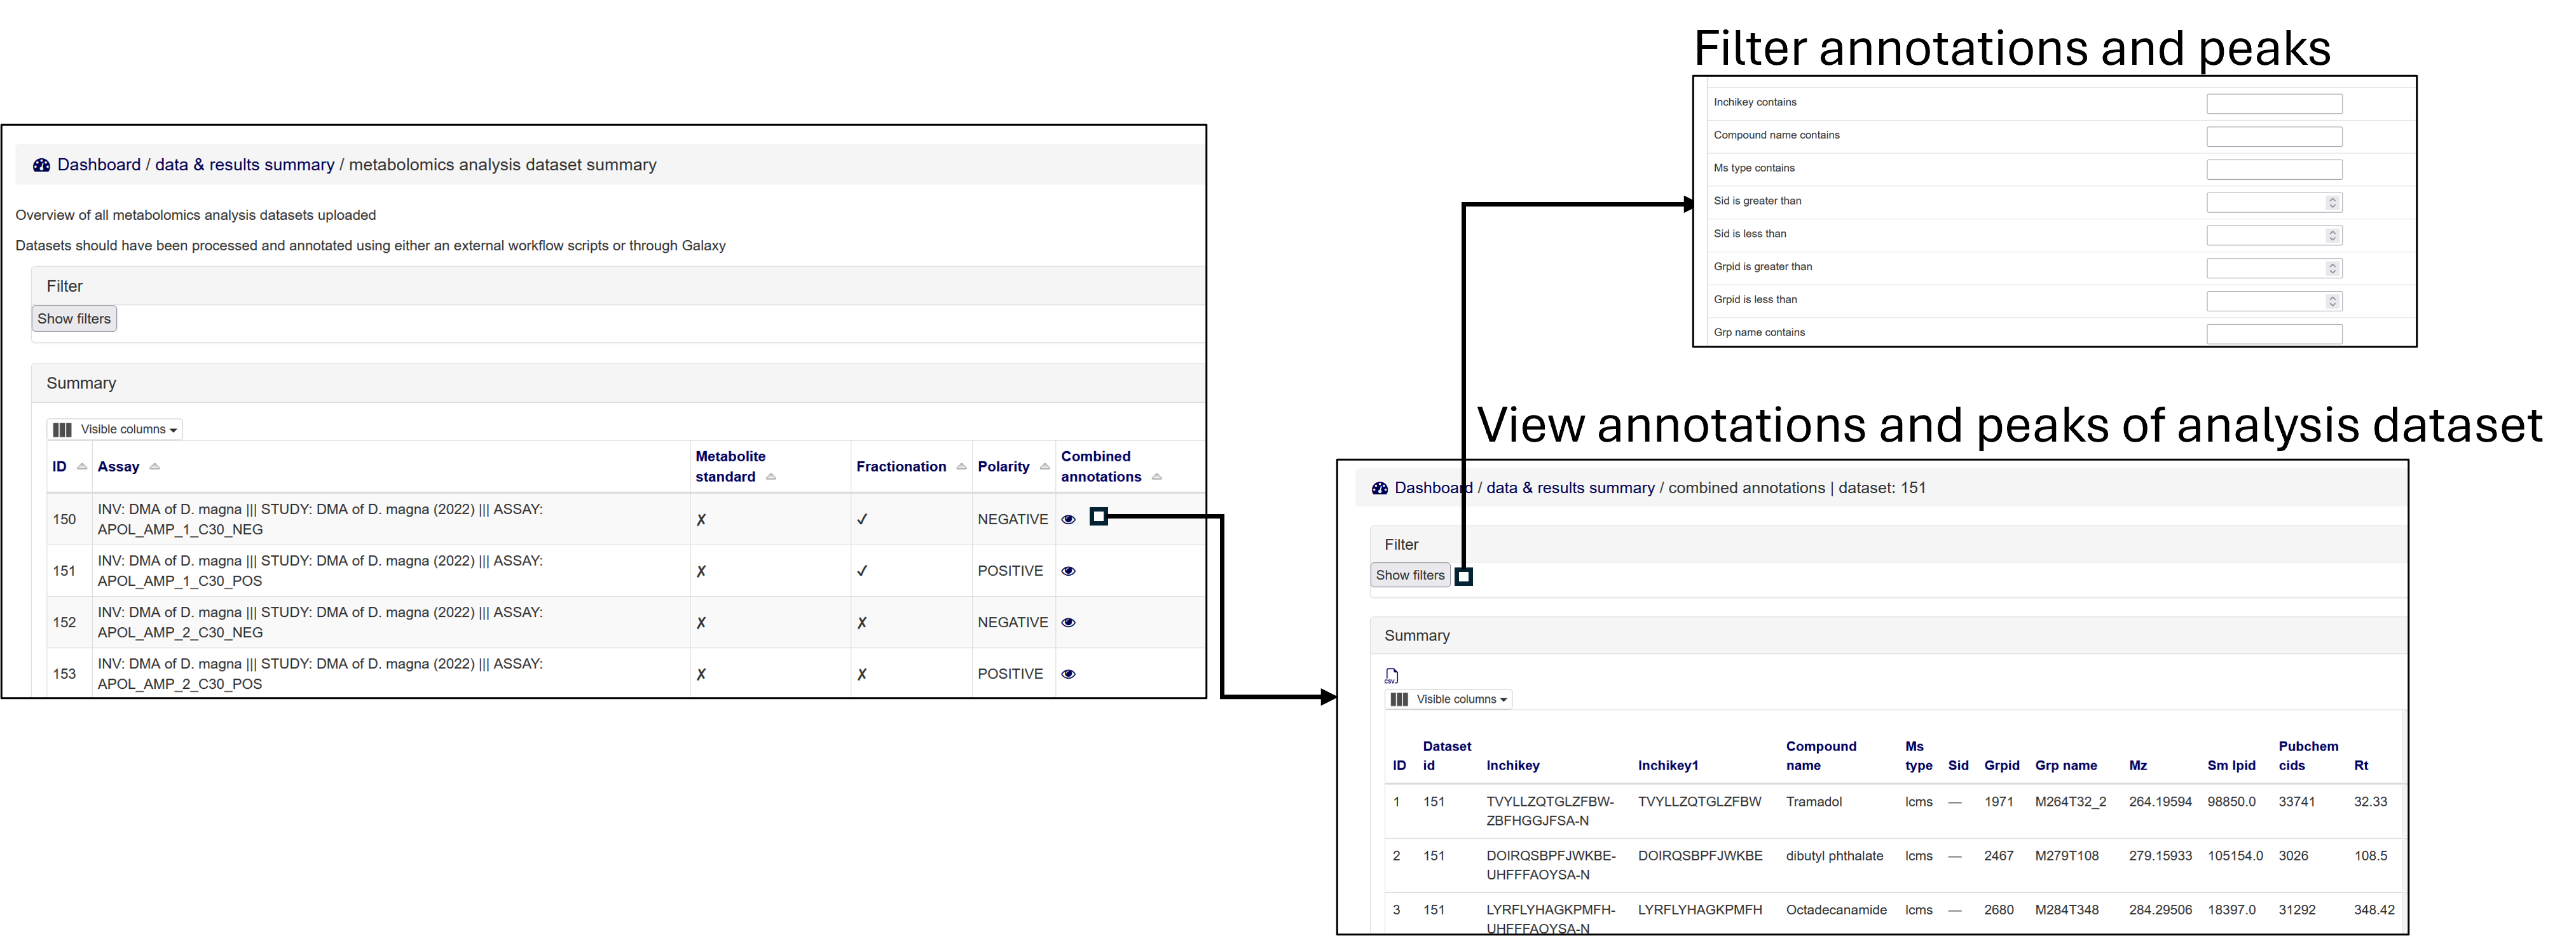
Fig 4. View (an filer) annotations and peaks from a specific analysis dataset
See below for definitions of columns:
Column name |
Description |
|---|---|
Inchikey |
InChIKey - International Chemical Identifier Key |
Compound name |
Compound name of annotation |
Ms type |
Mass spectrometry type (Fractionation data can either be “lcms” or “dims” if from the LC fractions) |
Sid |
Scan peak id (unique id for this dataset for the “dims” peak) |
Grpid |
Grouped peak id (unique id for this dataset for the grouped LC-MS peak) |
Grp name |
The name given by XCMS to the grouped LC-MS peak |
Mz |
m/z of the peak |
Rt |
Retention time of the peak |
Well |
If the peak from an LC fraction, the well from which the DIMS data was taken |
Sm score |
Spectral matching score - values between 0 to 1 (dpc) |
Metfrag score |
MetFrag annotation score (weighted score - see Galaxy workflow) - values between 0 to 1 |
Sirius score |
SIRIUS CSI:FingerID score (the ranking from SIRIUS CSI:FingerID was converted to a value between 0 to 1 using a “minmax” normalisation.) |
Ms1 lookup score |
A binary score, where 1 signifies a match of the a calculated neutral mass to a public metabolite database and 0 signifies there was no match |
Biosim max score |
A tanimoto similarity analysis between the structure of the annotated compound against a preselected list of compounds known to be from “biology” from HMDB |
Wscore |
A weighted score between 0 to 1 of - see the DMA Galaxy workflow for details of the weighting |
Rank |
A rank derived from the Wscore |
Adduct overall |
All adducts used to calculate the annotation |
The weighted scores for “Sm score”, “MetFrag score”, “Sirius score”, “Ms1 lookup score” and “Biosim max score” are all show in the table with the suffix “wscore”. See the DMA Galaxy workflow for details of the weightings used.
Views of the extracted ion chromatogram and fragmentation data can also be viewed.
The fragmentation data shown for both the individual spectra, the averaged spectra within the a file (intra) and the averaged spectra across all files (inter.)

Fig 6. view EIC and fragmentation data
The mass spectrometry fragmentation based fragmentation annotation results from DMA Galaxy workflow can also be viewed in further detail (Spectral matching, MetFrag and SIRIUS CSI:FingerID)

Fig 7. View the mass spectrometry fragmentation based fragmentation annotations derived from the DMA Galaxy workflow (Spectral matching, MetFrag and SIRIUS CSI:FingerID)
Exact mass search
A registered user can search all the annotations in batch via monoisotopic exact masses dmadb.bham.ac.uk/search_mono/.
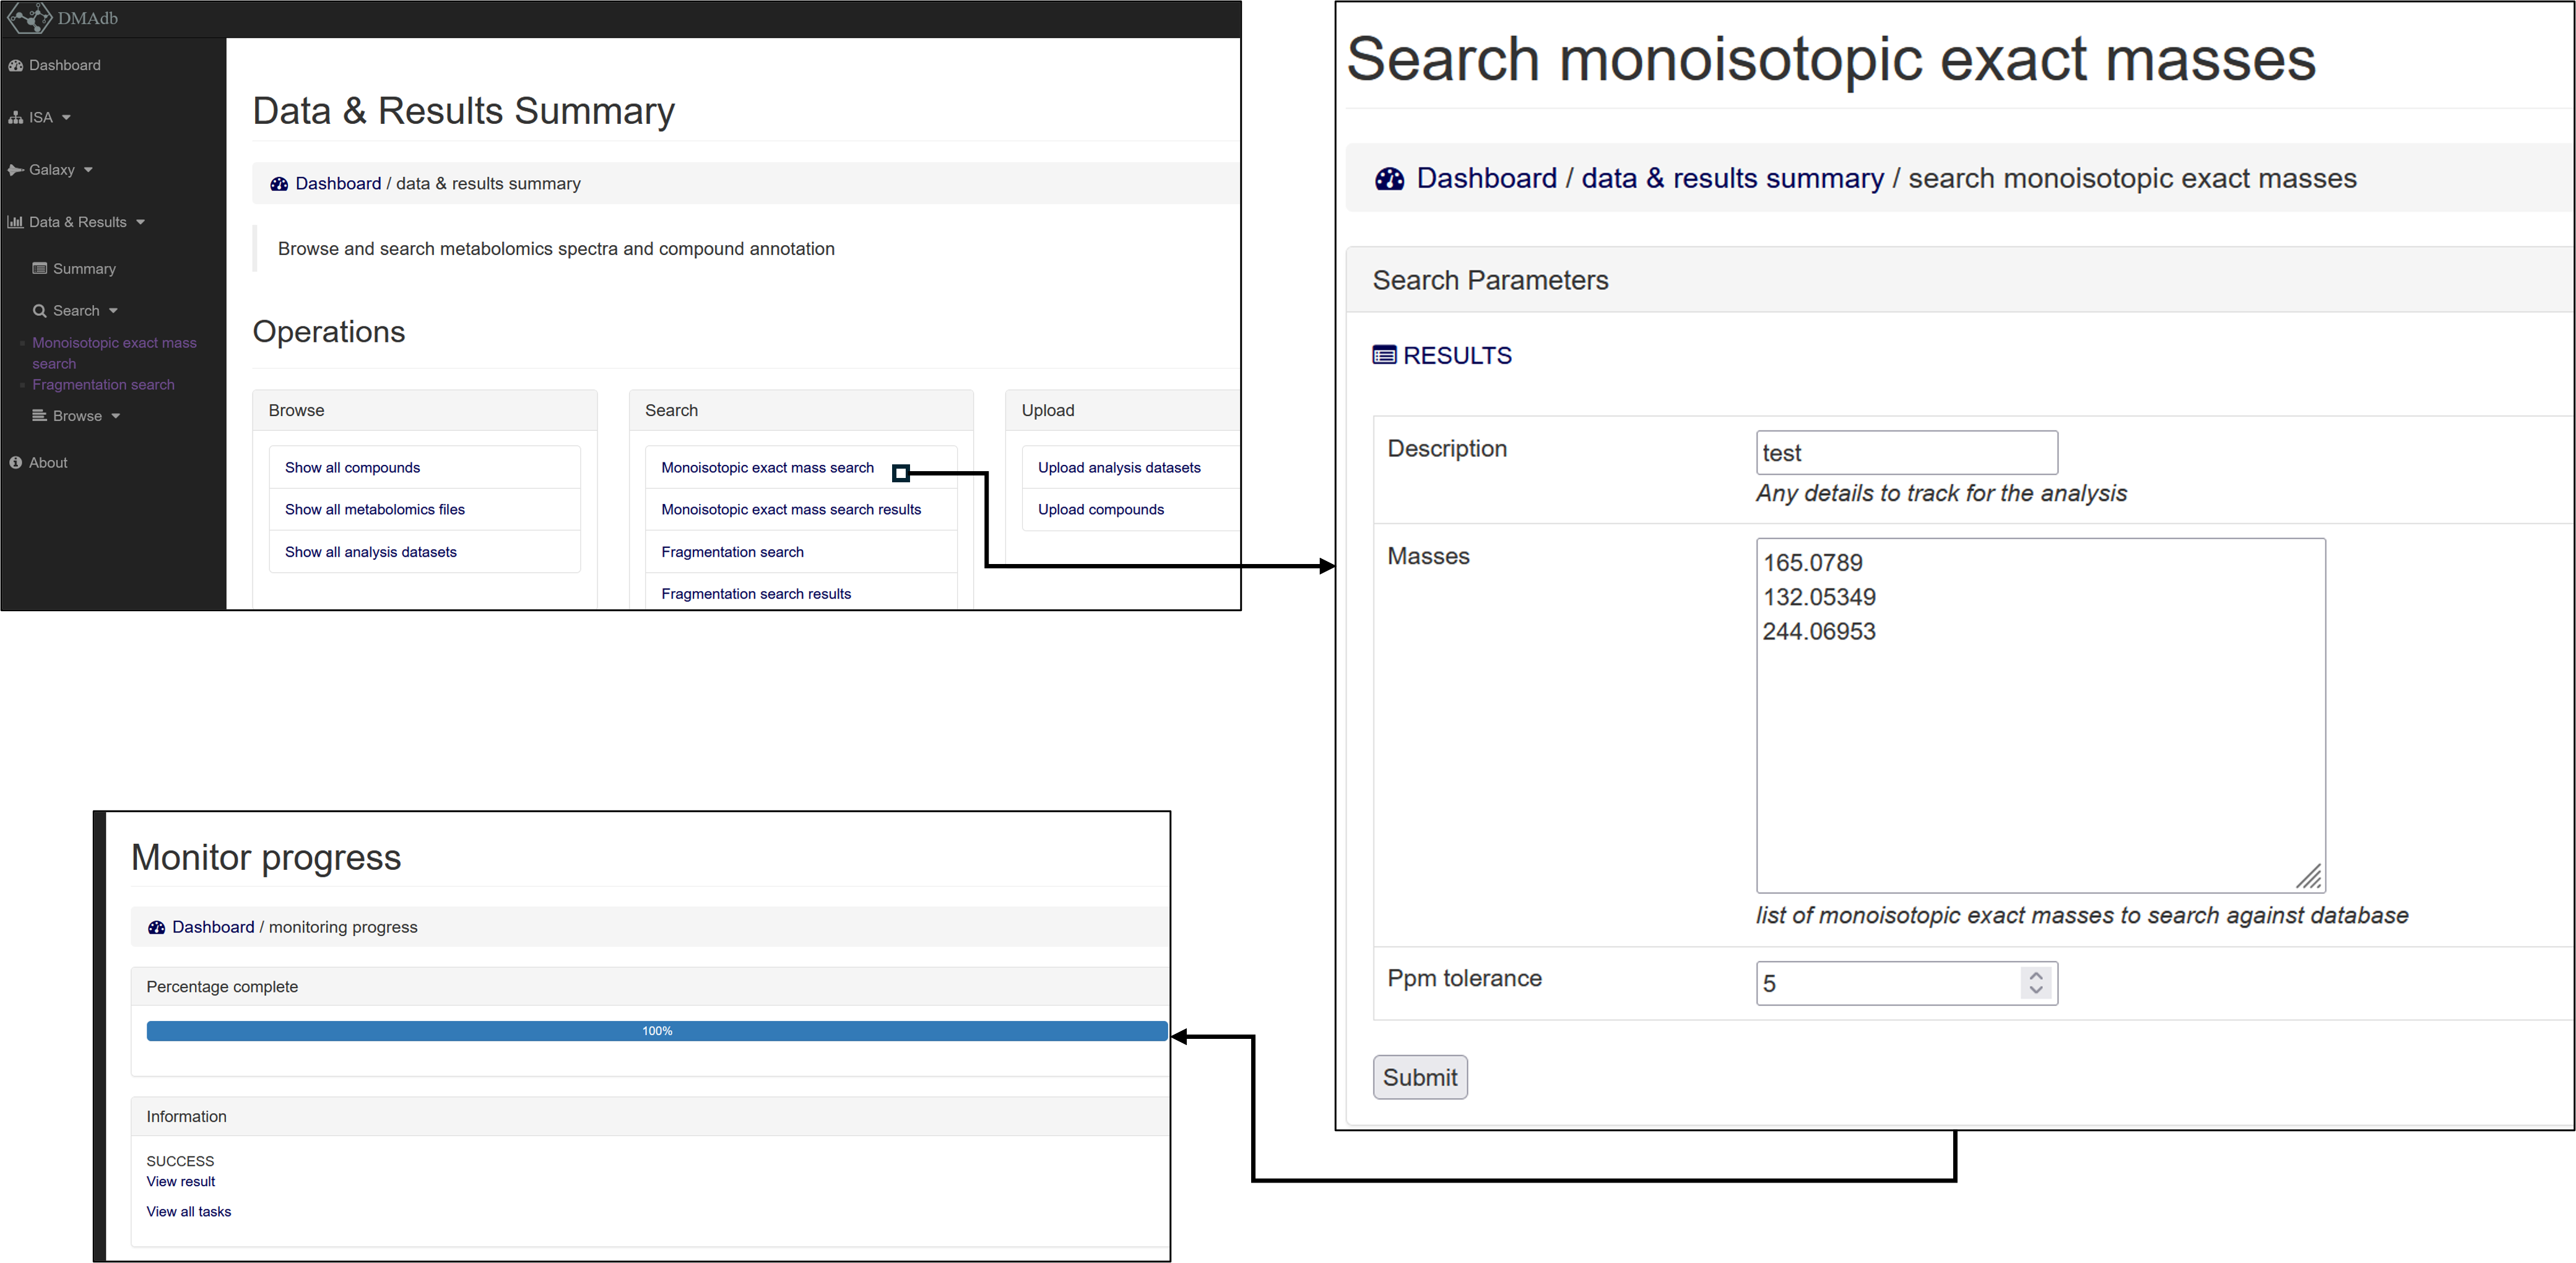
Fig 8. Search monoisotopic exact mass of annotations
The results are stored in the Monoisotopic exact mass search results section.
Where each row corresponds to batch query and the columns provide details of the parameters used for the search
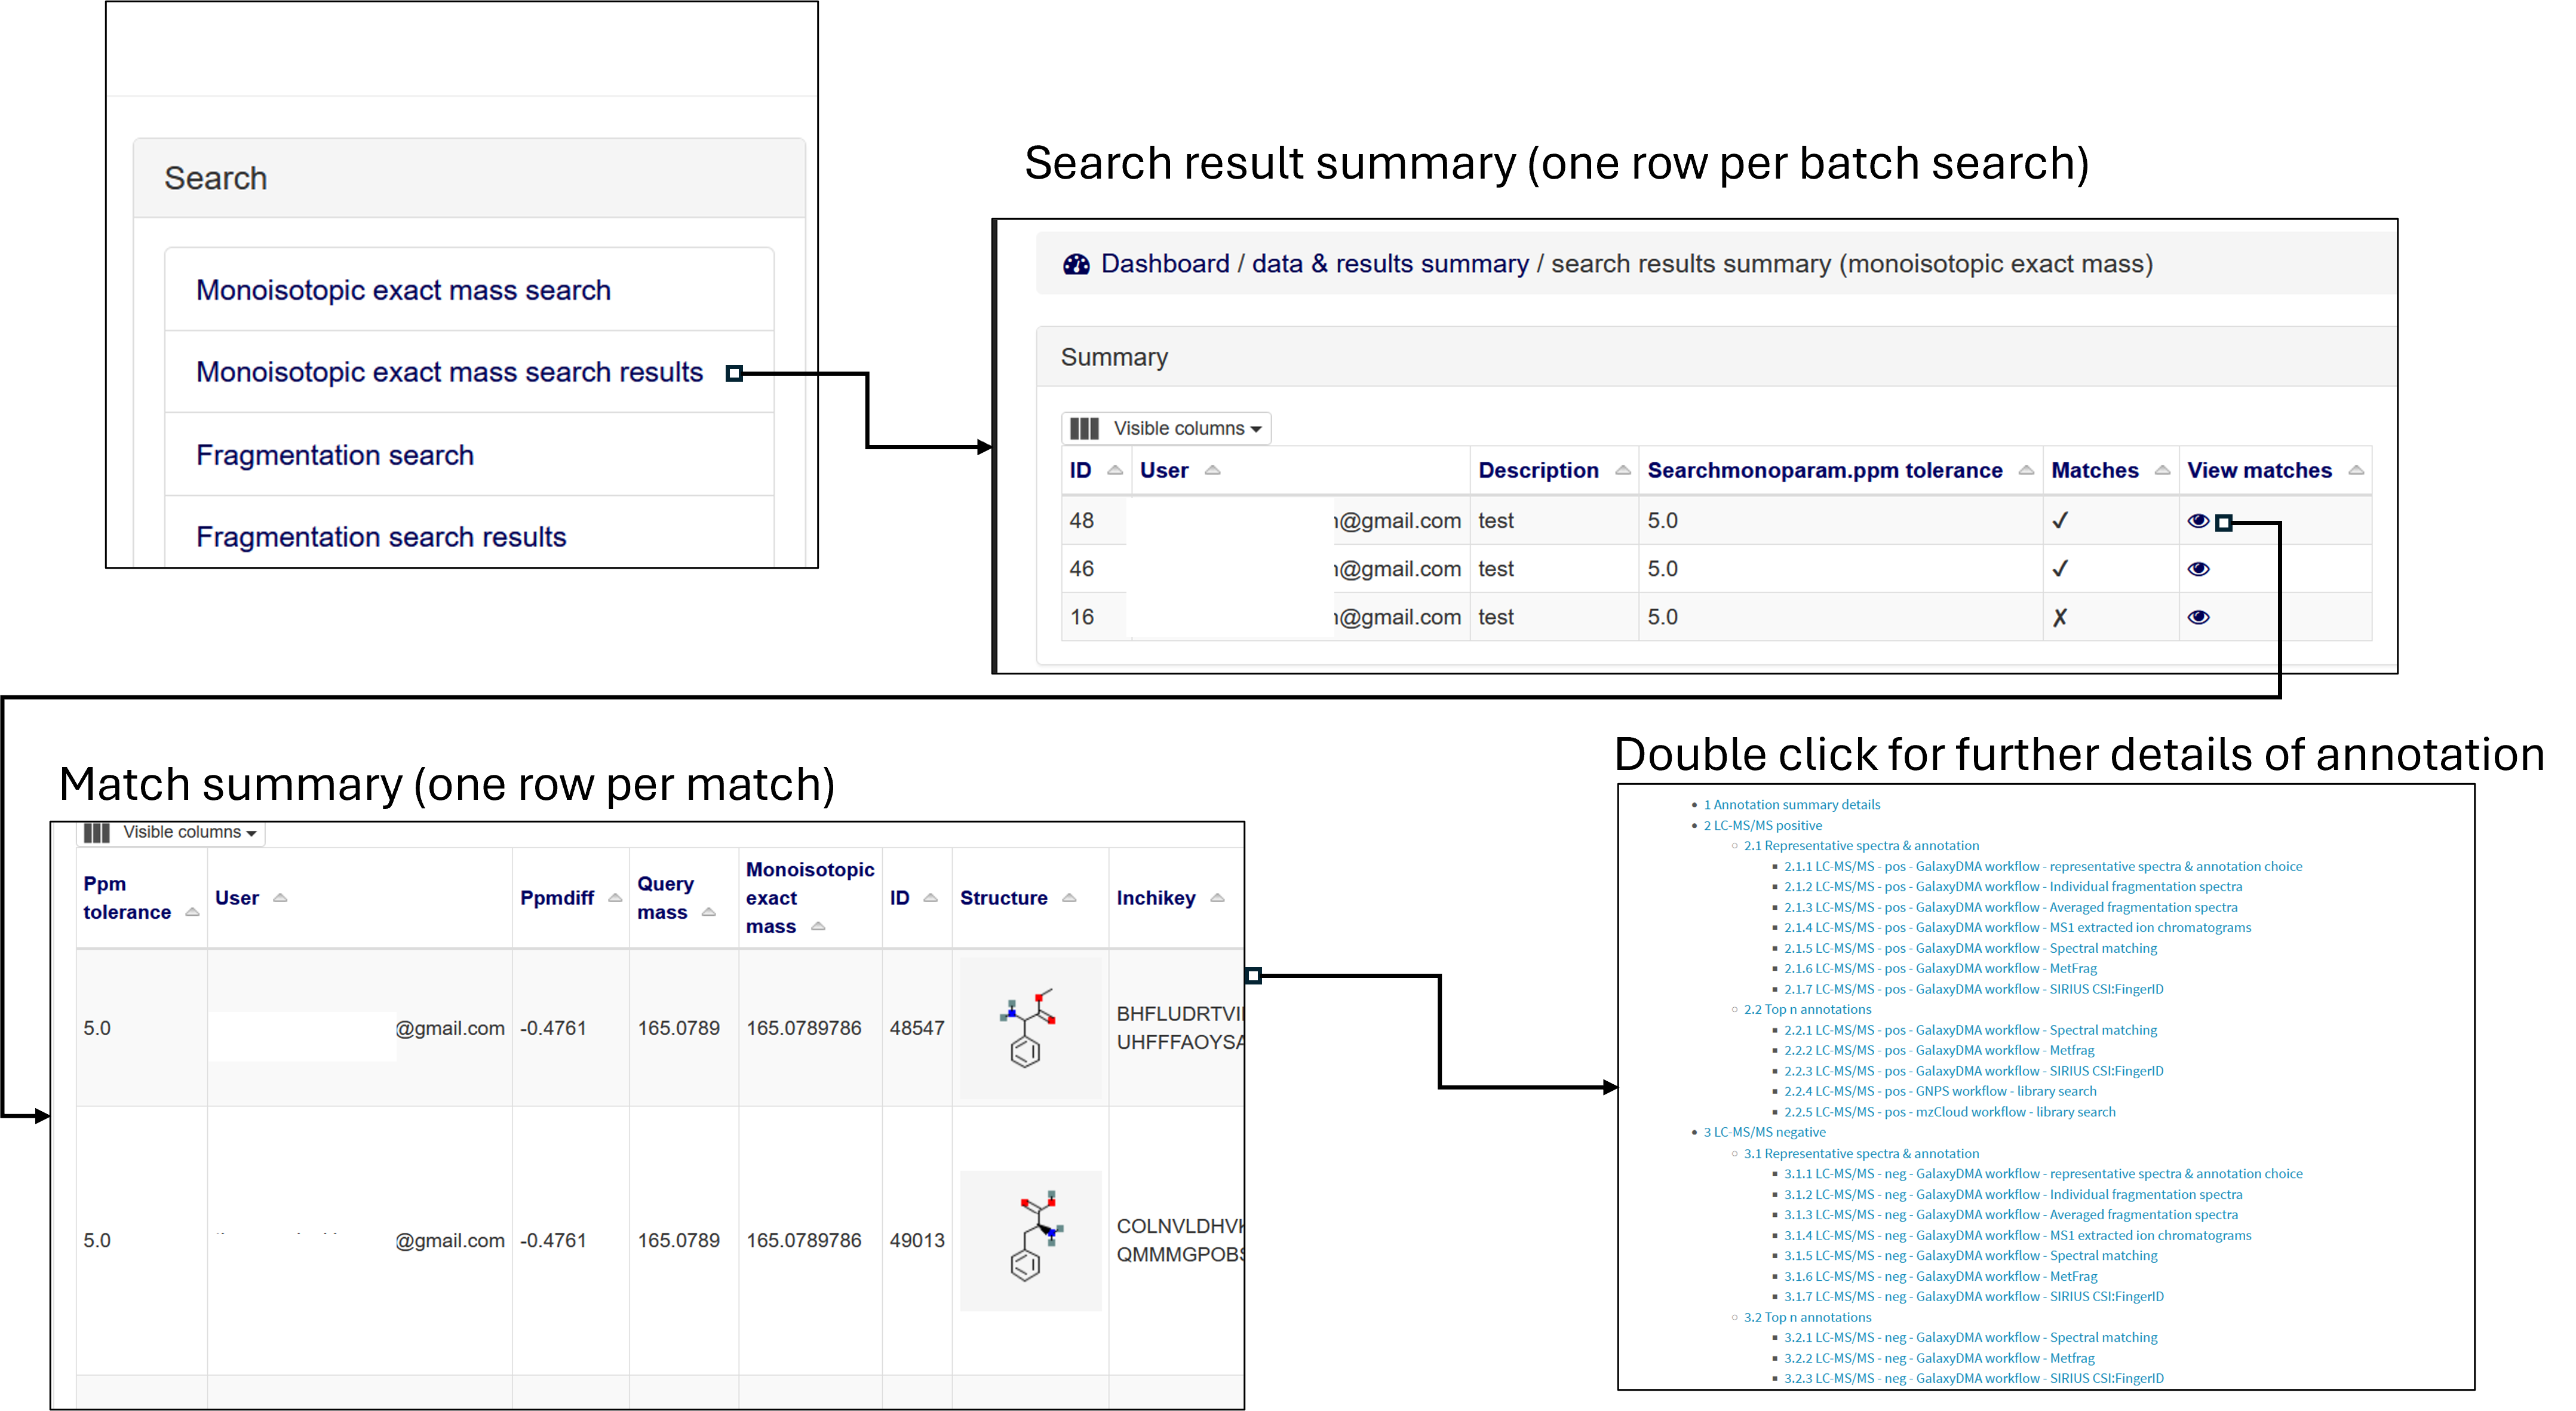
Fig 9. View all results from monoisotopic exact mass searches
The individual matches from the search can then be inspected within the match table. Where each row corresponds to a single match between a query monoisotopic mass and a monoisotopic mass within the available annotations in DMAdb.
The match table includes the relevant ppm difference of the queried mass and the mass in the library, as well as all the information regarding the compound detailed in dmadb.bham.ac.uk/compounds/
Column name |
Description |
|---|---|
Ppm tolerance |
PPM tolerance used as parameter for search |
User |
User who performed the search |
Ppmdiff |
The PPM difference between the query mass and the mass in DMAdb |
Fragmentation spectra search
A registered user can search query fragmentation spectra against all the fragmentation spectra within DMAdb, see dmadb.bham.ac.uk/search_frag/.
The DMAdb library spectra that can be searched consist of all the averaged spectra from the LC-MS/MS and DIMSn data.
For the LC-MS/MS fragmentation spectra this includes the averaged spectra within a file (intra) and the averaged spectra across the files (inter).
By default the datasets containing the metabolite reference standards will be avoided but they can be optionally included.
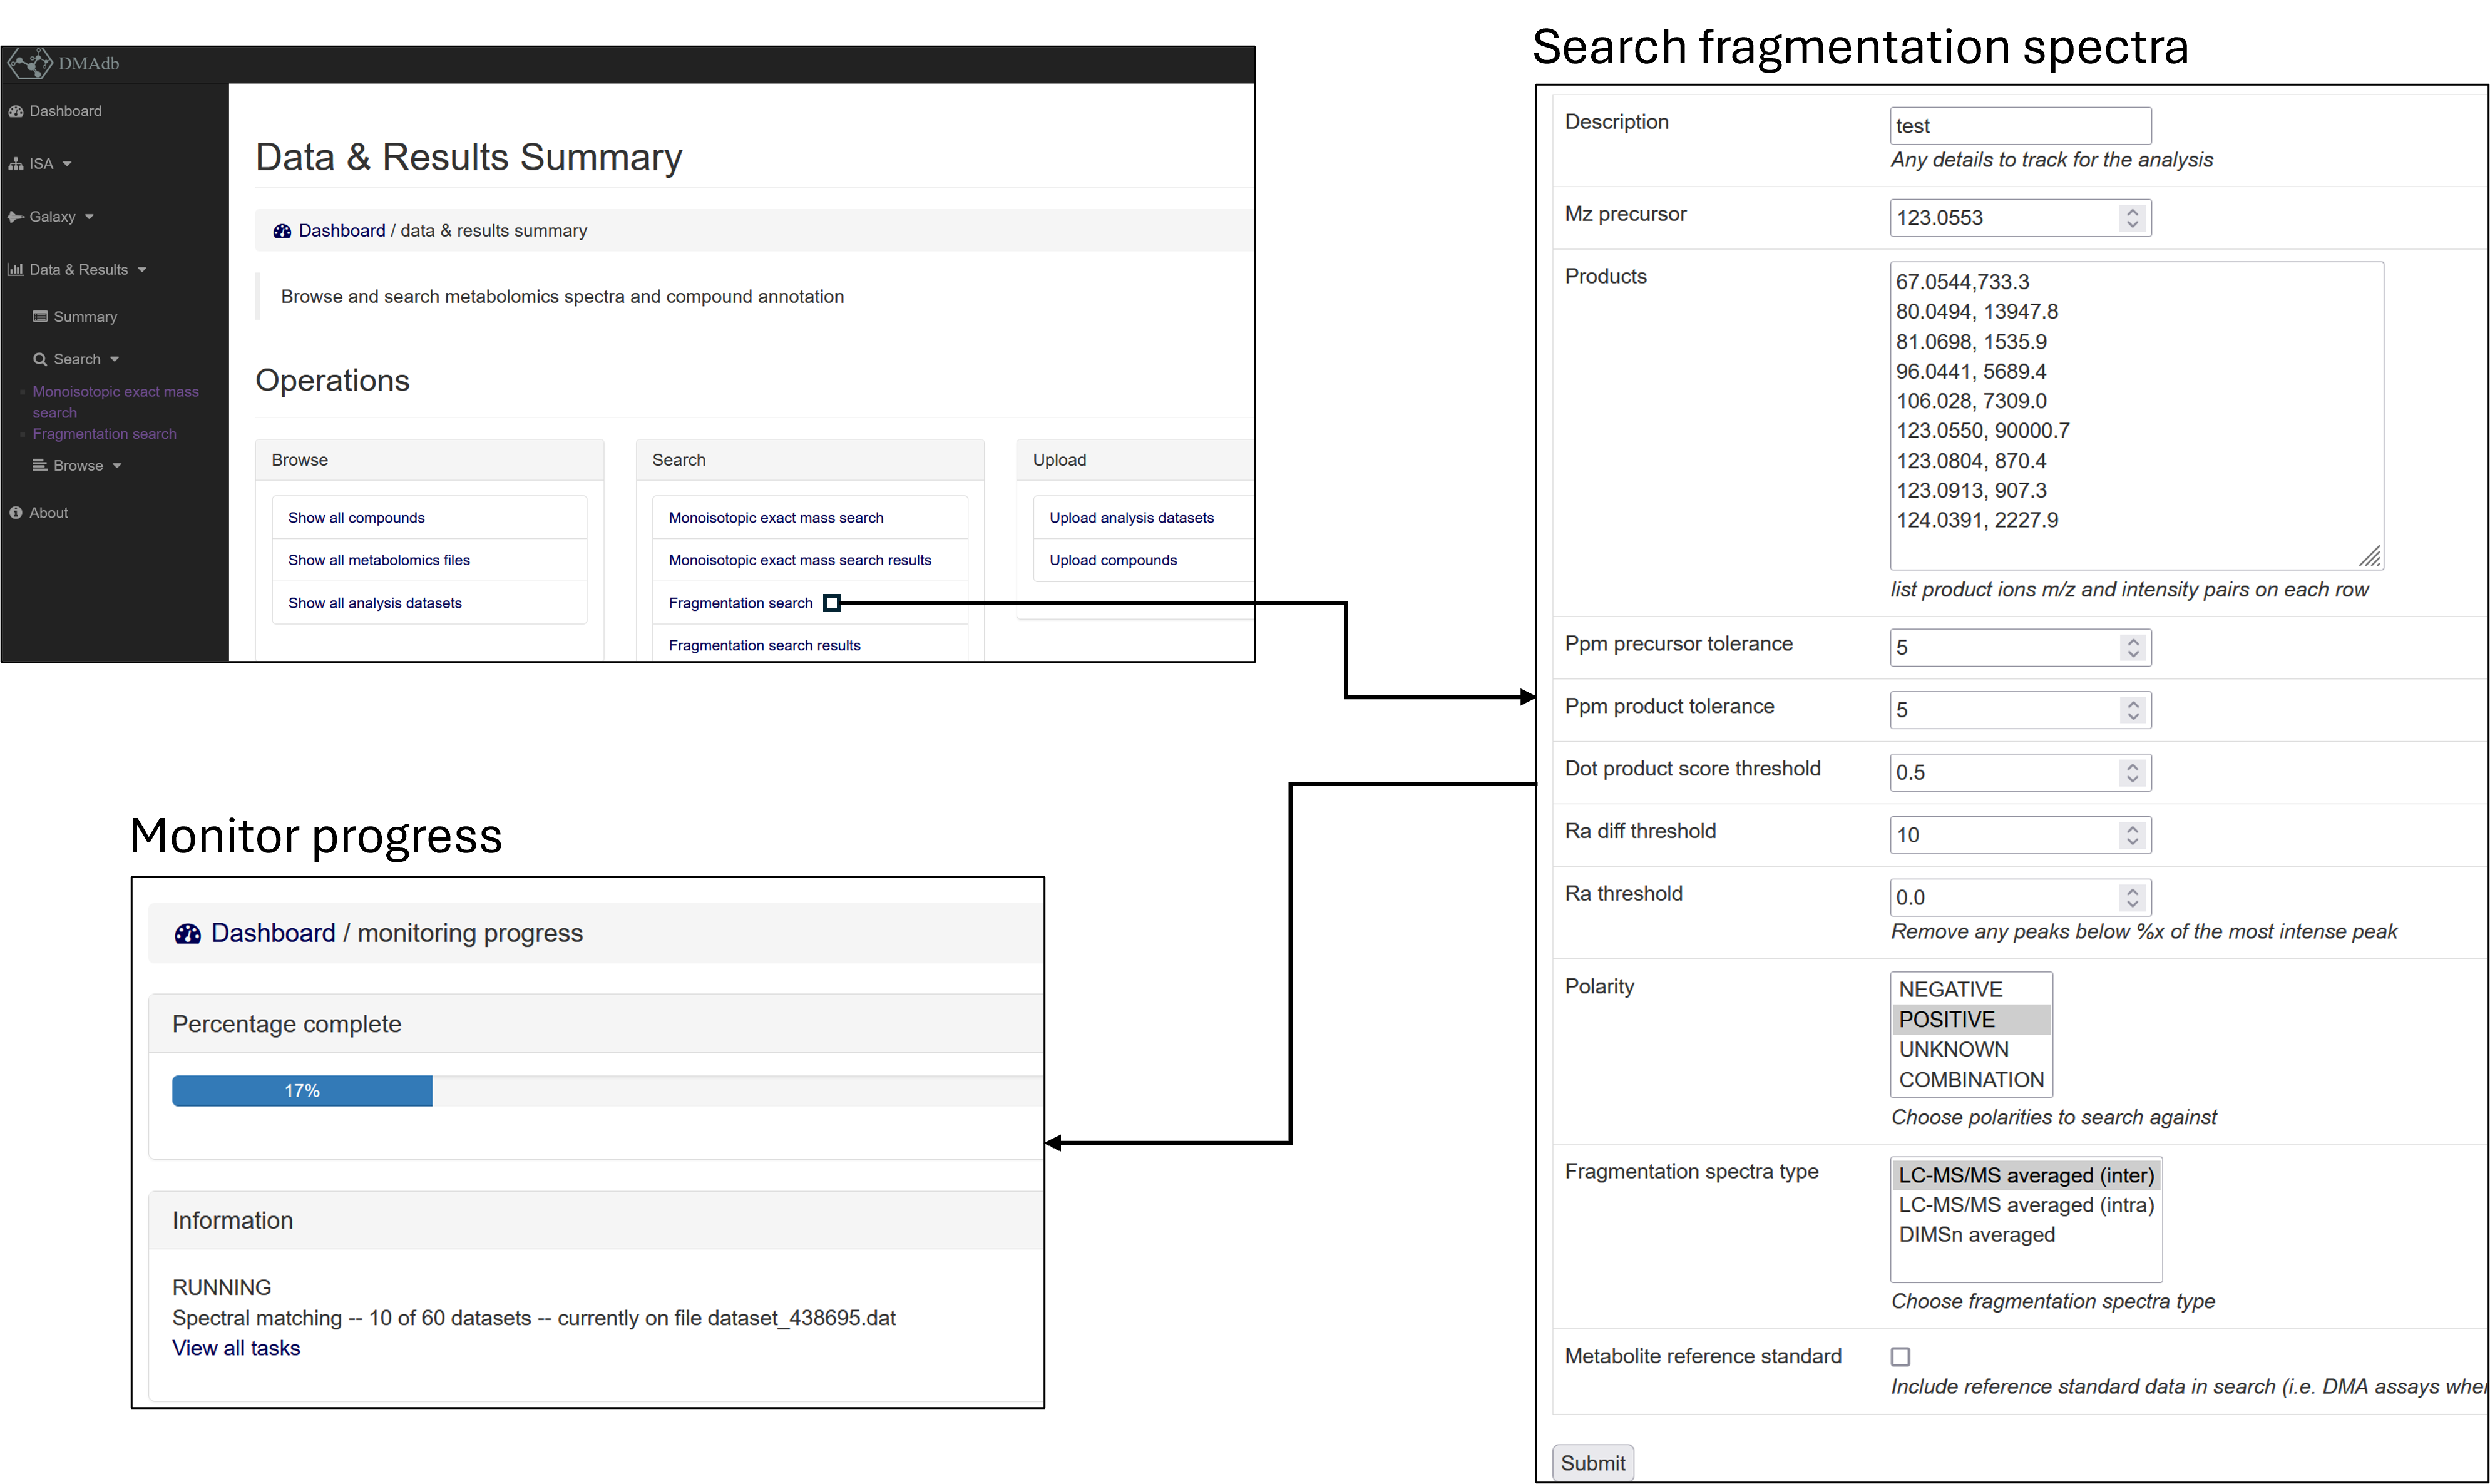
Fig 10. Search query fragmentation
Each set of search results are saved in the Fragmentation search results section.
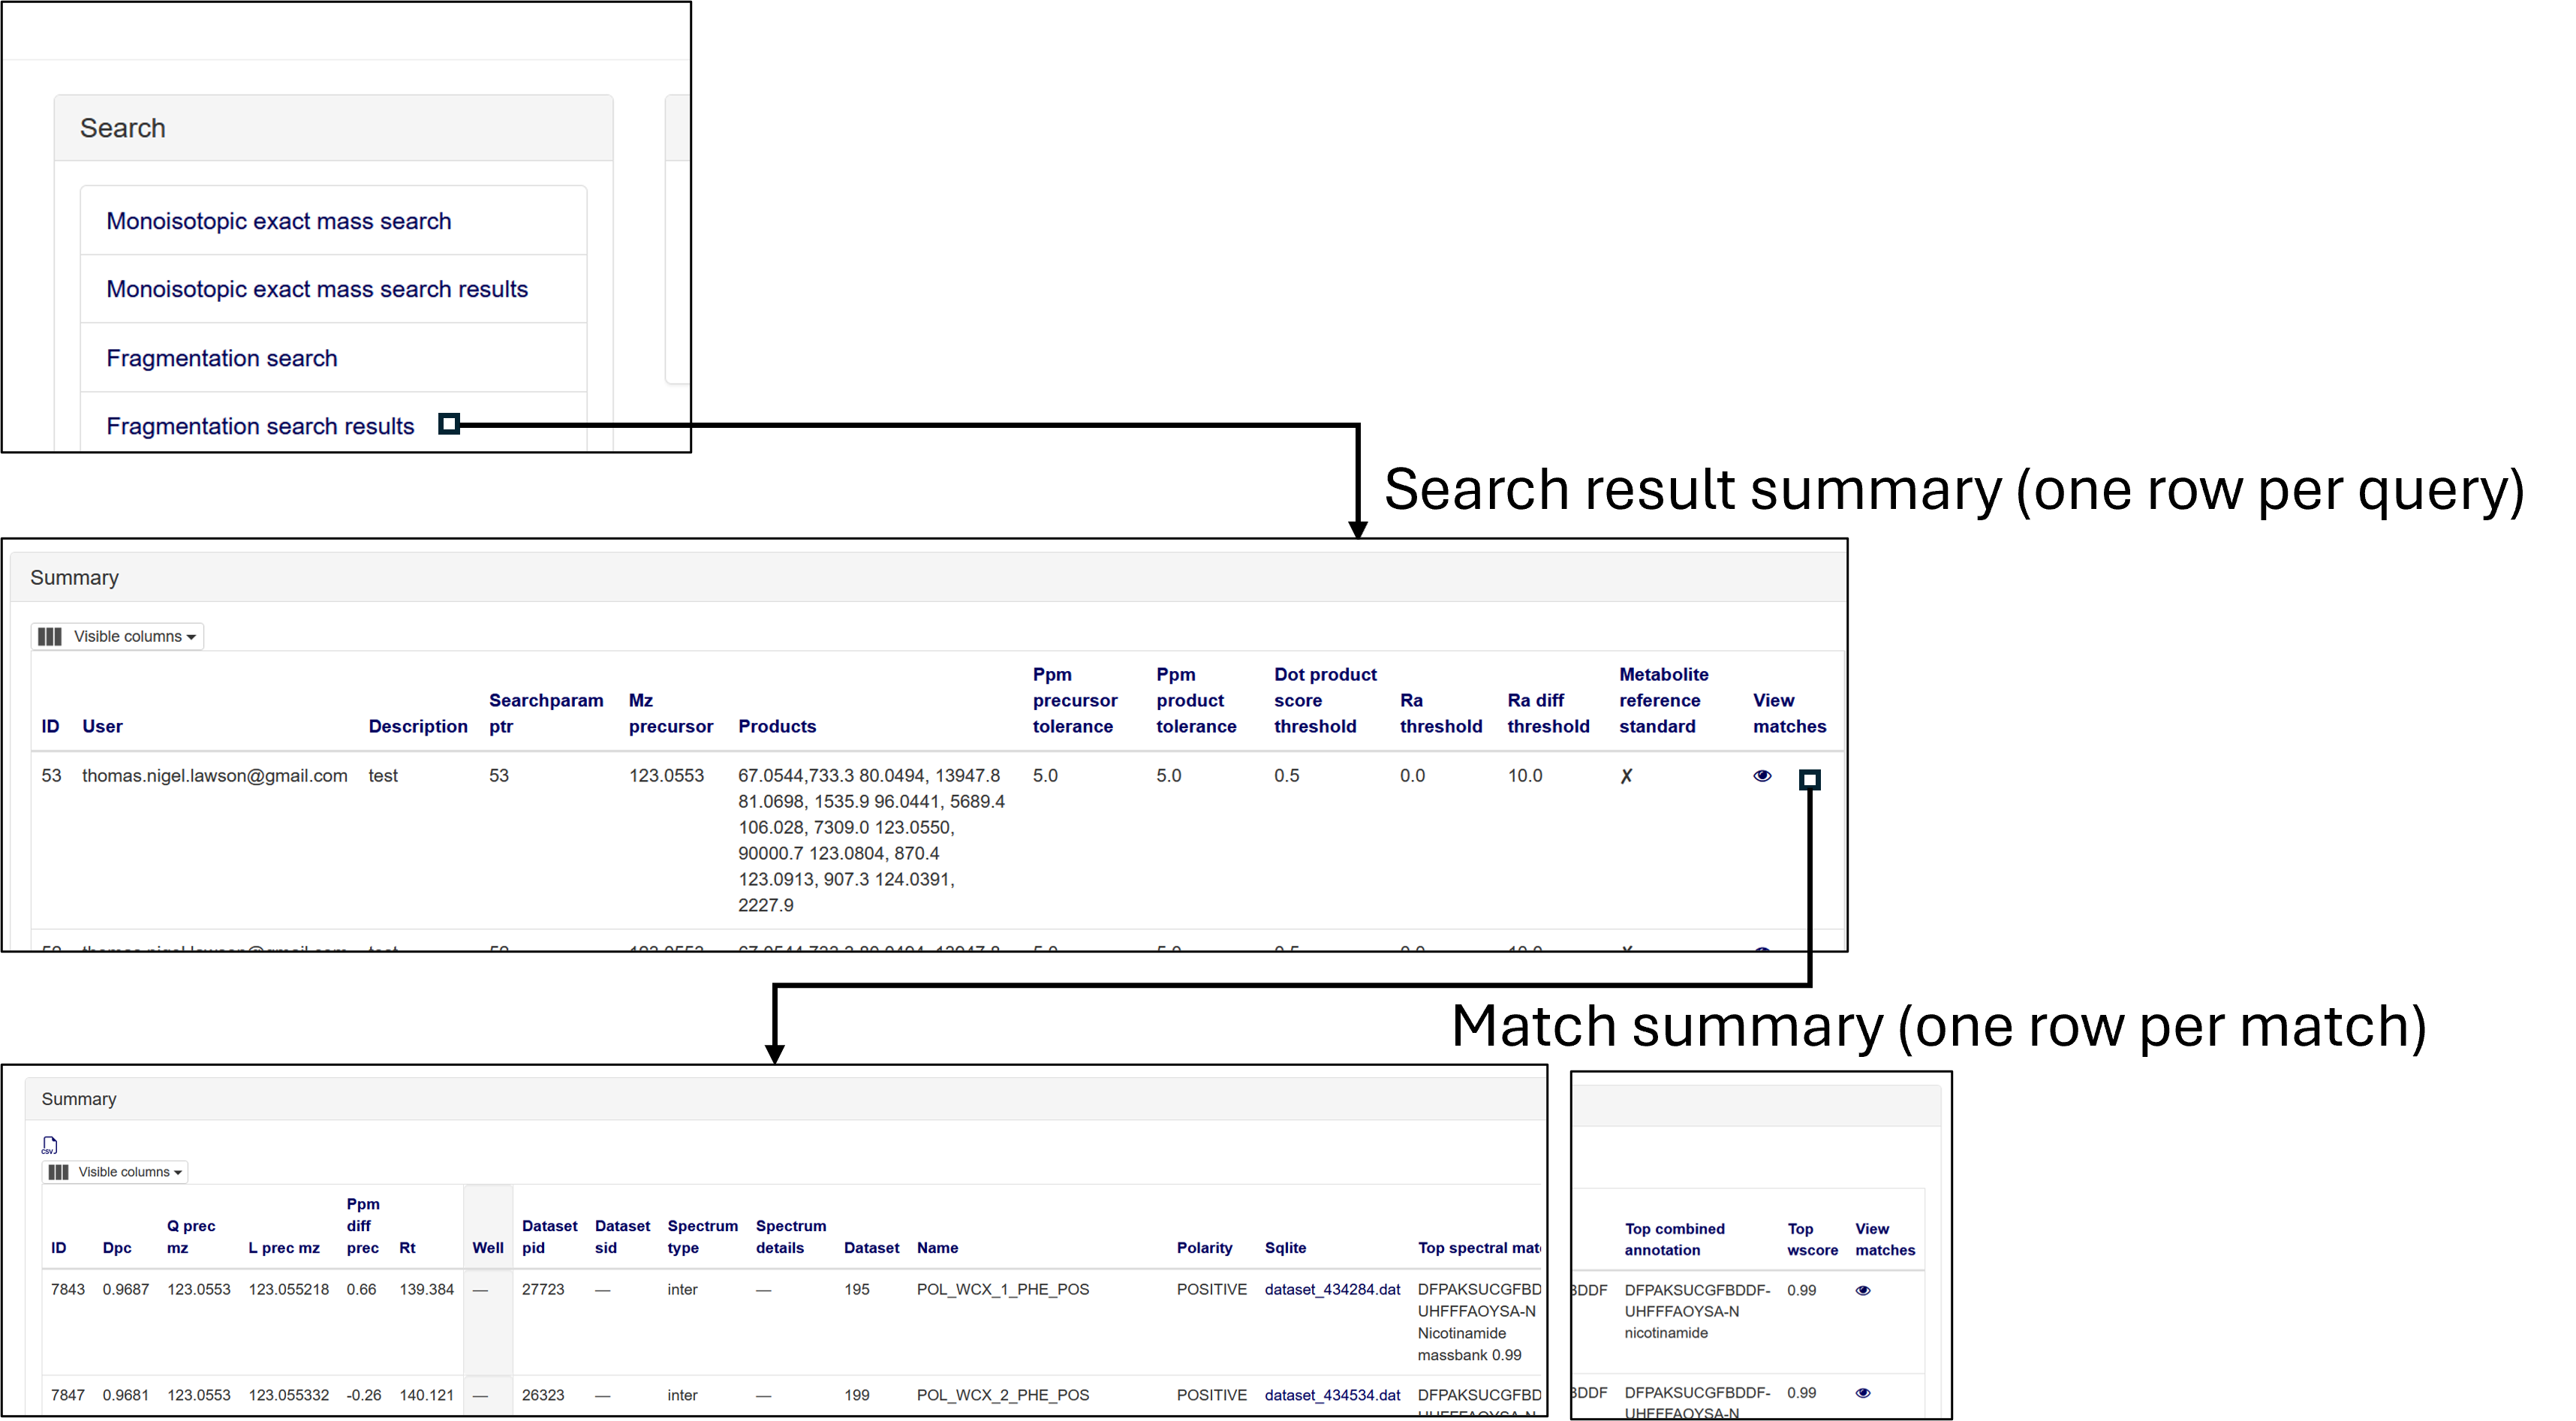
Fig 11. View all results from fragmentation searches
The individual matches from the search can then be inspected within the match table. Where each row corresponds to a single match between the query fragmentation spectra and the fragmentation spectra within DMAdb.
See below for descriptions of the match columns
Column name |
Description |
|---|---|
Dpc |
Dot product cosine match result |
Q prec mz |
The query precursor m/z (provided by user) |
L prec mz |
The library precursor m/z (from the DMAdb spectra) |
Ppm diff prec |
PPM difference between query and library precursor |
Rt |
Retention time of library spectra |
Well |
The well fraction of the library spectra, if library spectra from LC-MS fractionation experiment |
Dataset pid |
Library spectra identifier from within SQLite file for this dataset specific to the LC-MS/MS data |
Dataset sid |
Library spectra identifier from within SQLite file for this dataset specific to the DIMSn data |
Spectrum type |
Library spectra spectrum type, i.e. if the data is LC-MS/MS averaged (intra or inter) or averaged from DIMSn data |
Spectrum details |
Library spectra further details of the library spectra if available |
Dataset |
The DMAdb id of the analysis dataset which the library spectra originated from |
Name |
The assay name associated with this library spectra |
Sqlite |
The link to the SQLite analysis dataset which the library spectra originated from (note this might not be available for download depending on access issues) |
Top spectral match |
Top spectral match result for this library spectra |
Top metfrag |
Top MefFrag results for this library spectra |
Top sirius csifingerid |
Top SIRIUS CSI:FingerID result for this library spectra |
Top combined annotation |
Top combined annotation (see DMA Galaxy workflow details for combining approach) for this library spectra |
Top wscore |
Top weighted score (see DMA Galaxy workflow details for weighting approach) for this library spectra |
Individual matches can be inspected in more detail, see below. Where the spectral match plot can be viewed between the query and the matched library spectra. Further details of the annotation results of the library spectra is provided as well.
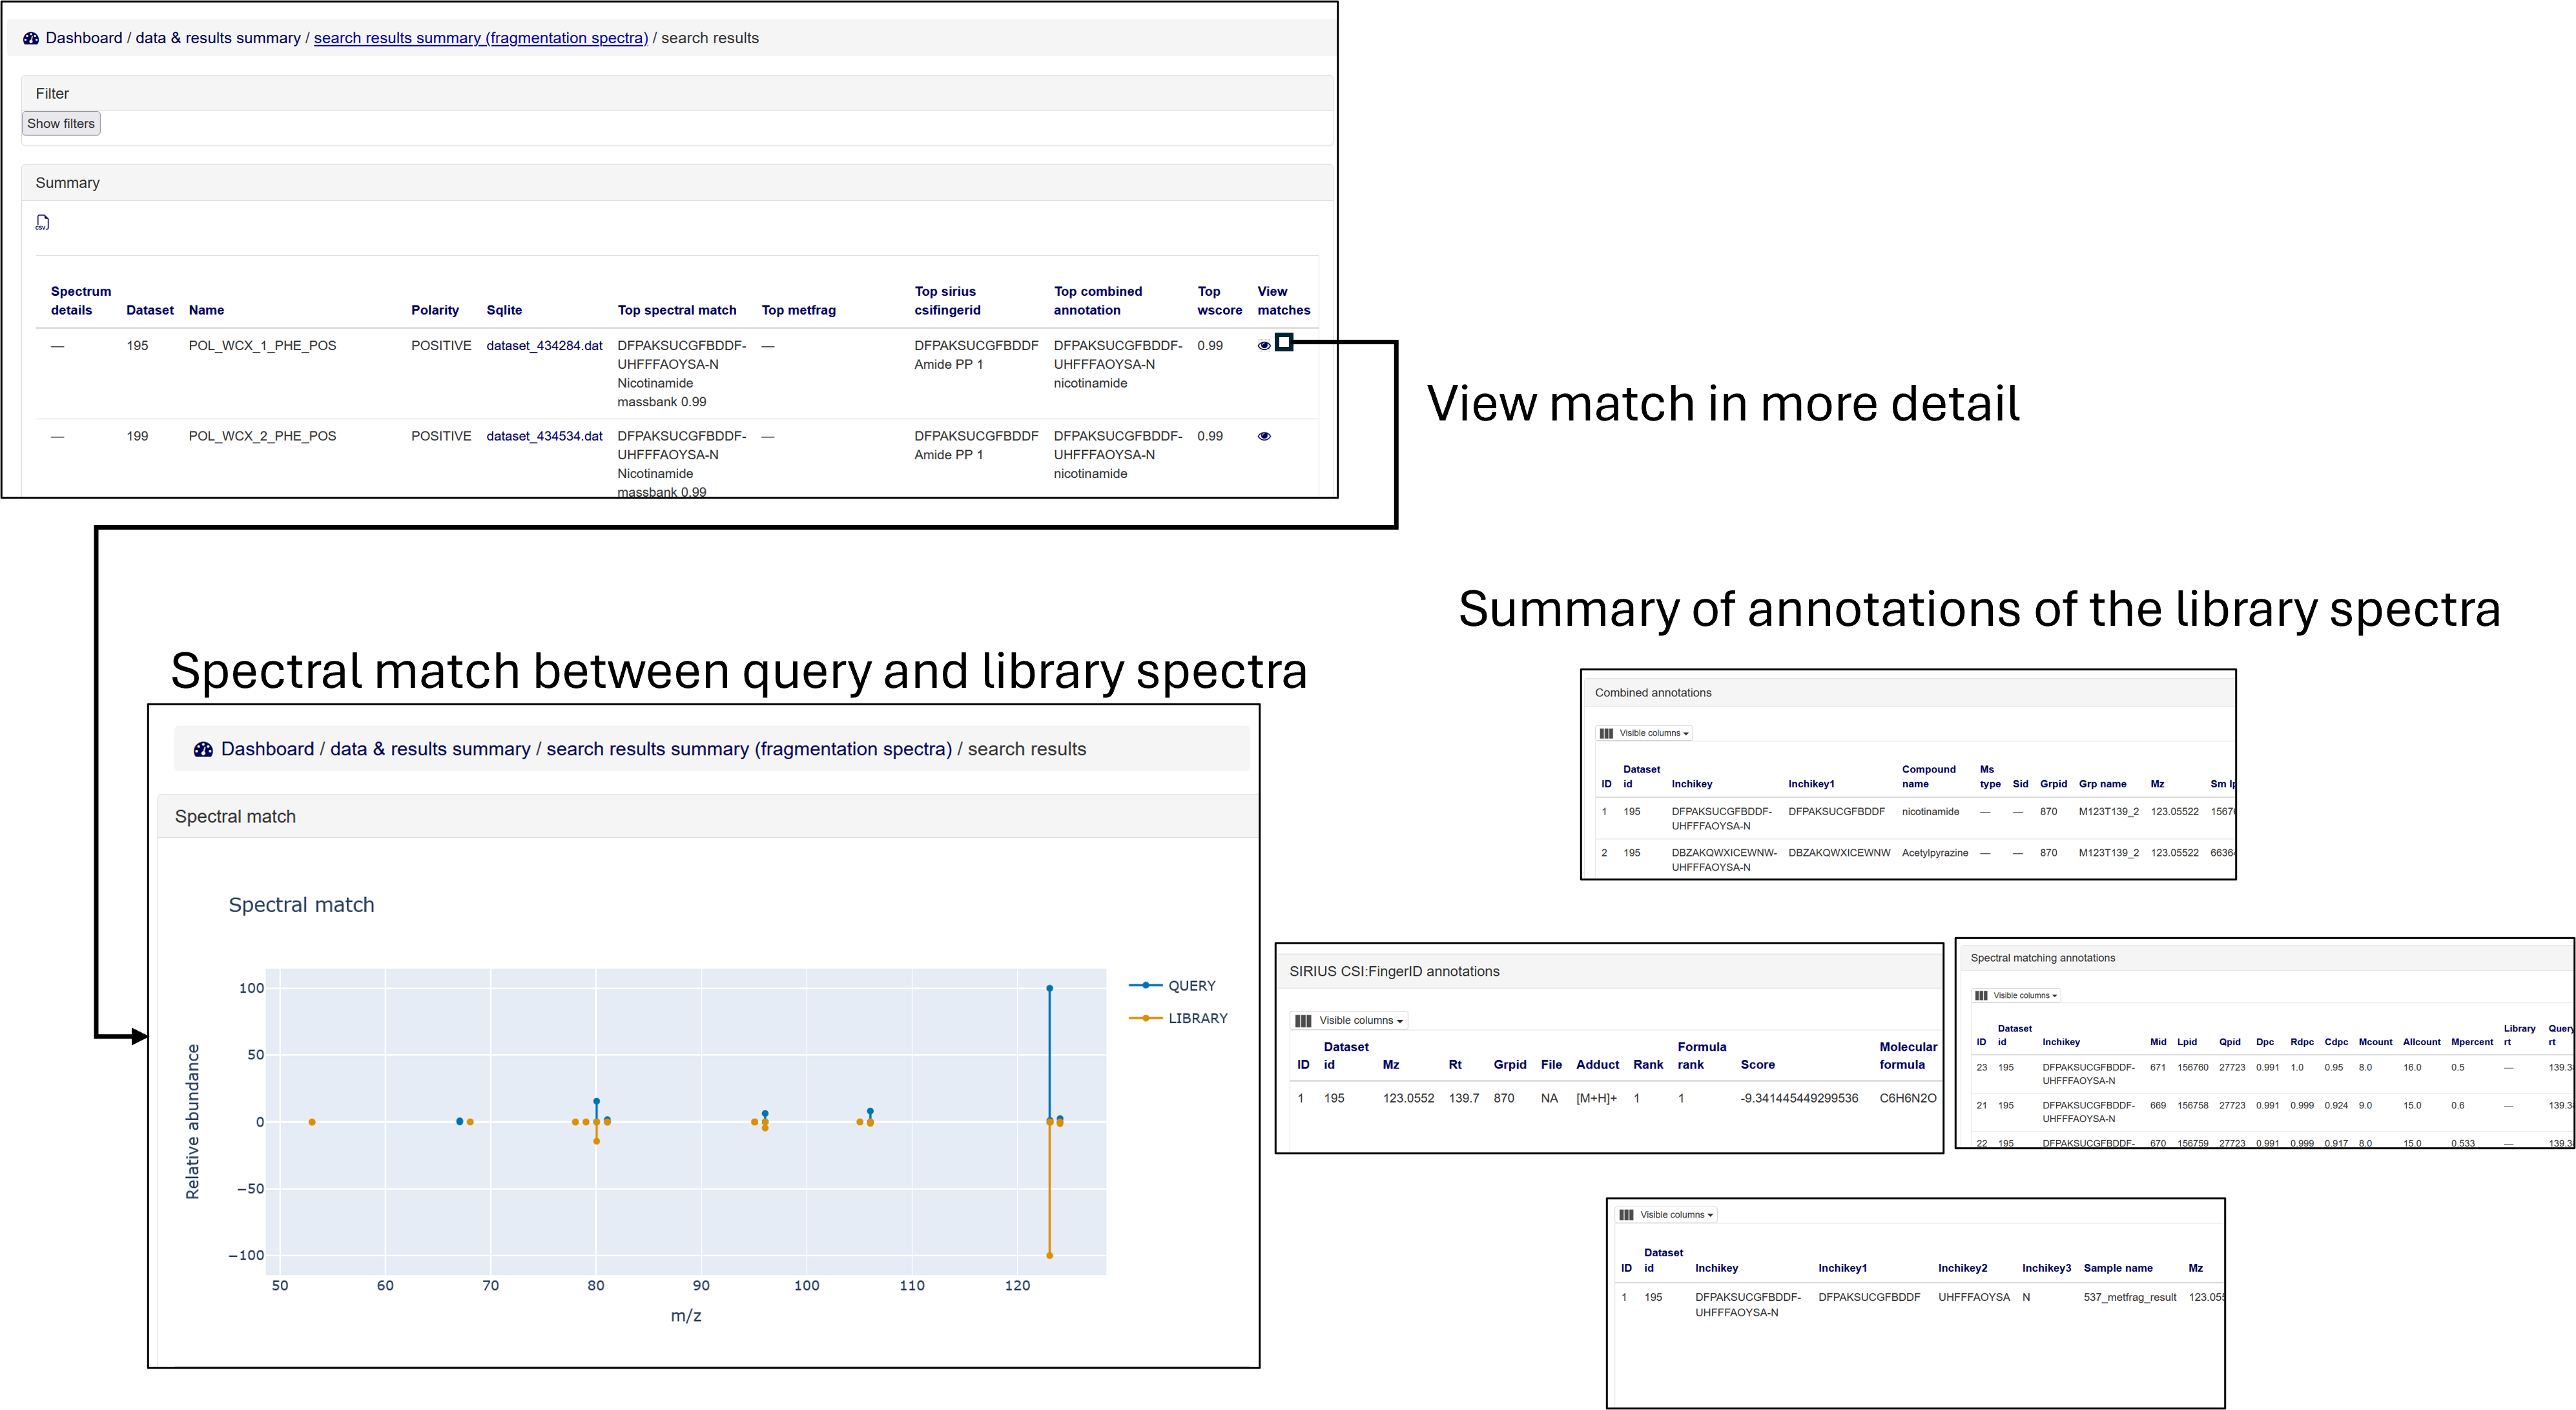
Fig 12. Further details for spectral match
Upload (admin only)
Admin users can upload analysis datasets via the Upload analysis datasets and a summary list of compounds via the Upload compounds section.